
Analytics & Intelligence
LiveEvery number explained. Every chart one click from its records.
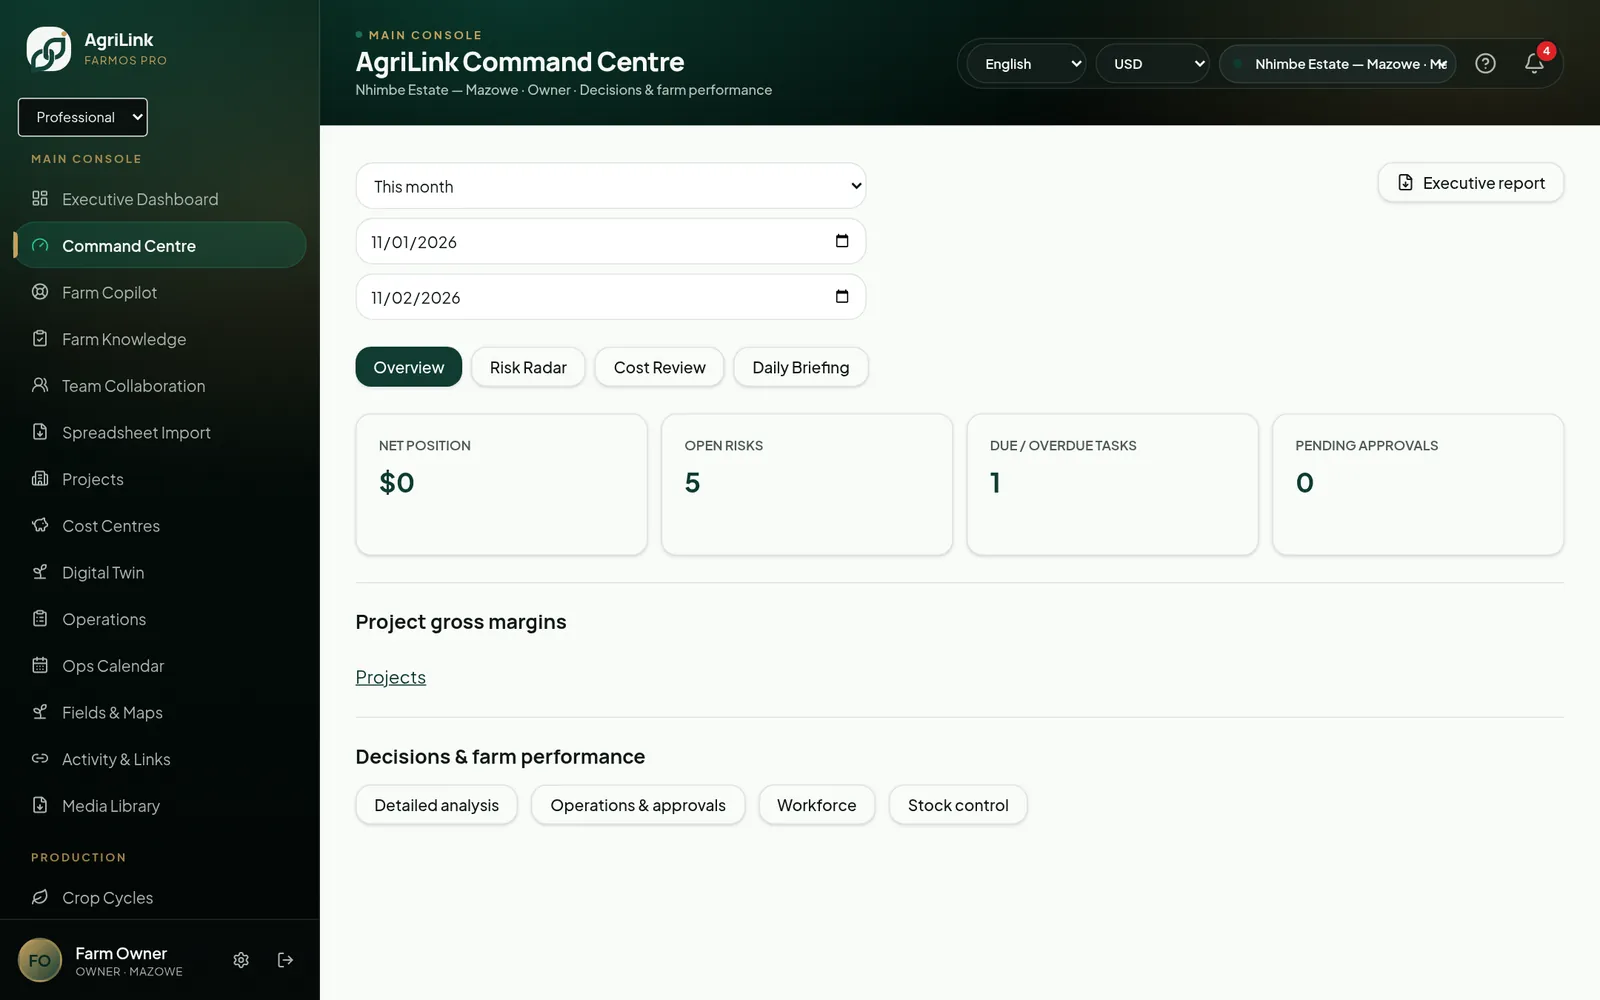
Executive dashboards, KPI hover previews, comparisons between fields, seasons and enterprises, and a farm integrity check that reconciles money, stock and payroll.
The problem
Dashboards that can't be trusted
- Totals don't match the books.
- Charts can't explain themselves.
- Comparisons are done by hand in Excel.
The AgriLink way
One connected record.
AgriLink's analytics read the same records as every module, show how each figure is calculated and let you drill down to the underlying entries.
Key capabilities
What Analytics & Intelligence does
Executive dashboard
Farm summary, alerts, profit, weather and risk.
KPI drilldowns
Point at a number to see the records behind it.
Comparisons
Fields, seasons, enterprises and farms side by side.
Integrity checks
Stock, money, payroll and trace chain reconciled server-side.
Saved views
Save filters for the views you use every week.
Reports
Printable reports and exports for every module.
How it works
Four steps, no re-typing.
- 1Records flow in from every module.
- 2Dashboards update automatically.
- 3Drill into any figure.
- 4Share reports with your team.
Feature group I
Analytics & AI
Every feature shows whether it is live, live with limits, or planned — so you know exactly what you get today.
- Executive dashboardsOwner and manager overviews.Live
- Customisable dashboardsChoose and arrange widgets.Planned
- Interactive KPI cardsHover previews of underlying records.Live
- KPI drilldownsFrom a number to its records.Live
- Farm performance analyticsYield, cost and productivity trends.Live
- Comparative analyticsFields, seasons and enterprises compared.Live · limited
- AI Farm AssistantAdvisors that read your farm records.Live
- AI-generated insightsExecutive briefings and risk summaries.Live · limited
- Risk alertsWeather, disease and operational alerts.Live
- Digital TwinTwin Health Score and relationship map.Live · limited
Drilldown
on every KPI
Daily
integrity reconciliation
Saved
views per user
Connected features
Works hand in hand with
Who uses it
Popular with
Ready to bring analytics & intelligence into one system?
Other modules: Farm Management · Crop Management · Livestock Management · Farm Operations · Workforce Management