
Interactive demo
Walk around a farm that runs on AgriLink.
No sign-up needed. Everything on this page is sample data, so click freely — nothing is saved.
1 · Farm map
Click a field, paddock or building.
Switch the colouring to compare land use, modelled crop health and cost per hectare.
Mazvikadei Sample Farm · sample data
Tip: use Tab and Enter to move between areas. In the real app, boundaries are drawn on satellite maps.
field
Field A
Maize · SC 727 · 12.4 ha
- Stage
- Tasselling · day 74
- Soil
- Red clay, pH 5.8
- Irrigation
- North pivot
- Cost to date
- $7,564
- Forecast yield
- 7.1 t/ha
Linked tasks
- Top-dress AN — approved
- Scout for fall armyworm — due Fri
Illustrative example — sample data, not a customer result.
2 · Task to money
One job, followed all the way to the profit line.
Press Play, or step through. Watch labour, inputs and machinery post to the field once — and only after approval.
Field A · cost ledger (sample)
- Nothing posted yet — costs appear as the work is recorded.
Waiting for approval
Costs are held until a manager approves the work.
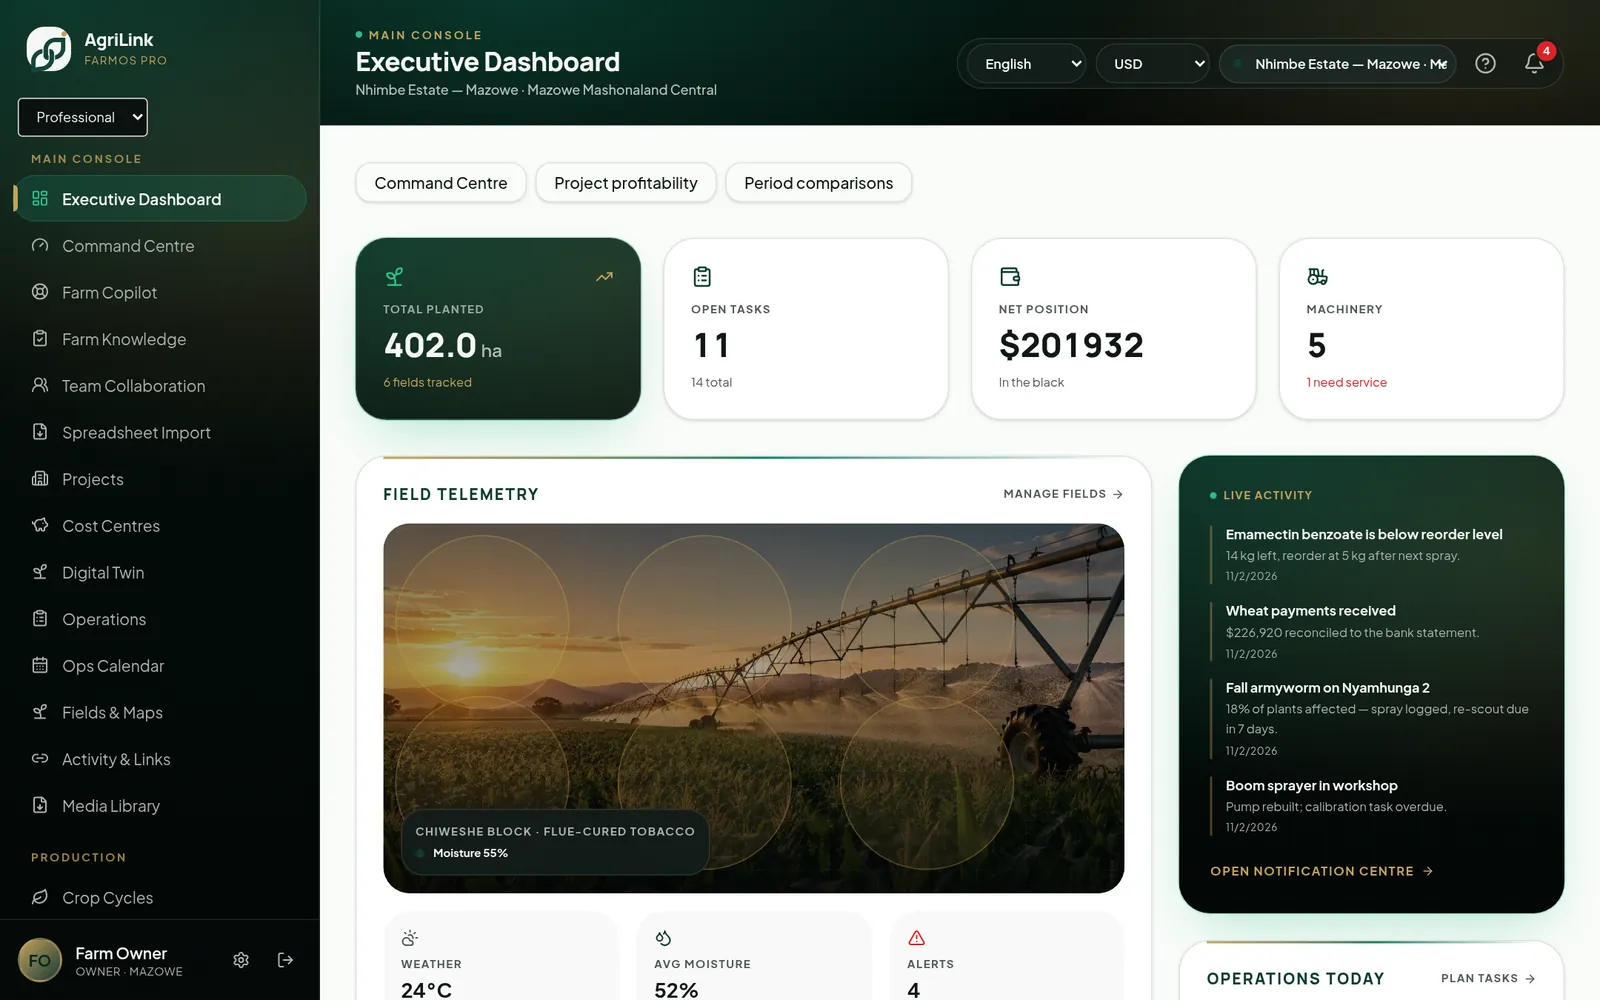
3 · Click-through dashboard
Click any number to see what's behind it.
4 · Digital Twin preview
A live model of your farm — scored on how complete it is.
60
Twin health
The Digital Twin is only as good as the records behind it. Switch parts on and off to see how the score responds.
Simplified illustration of the in-app Twin Health Score.