
I · Analytics & AI
LiveFarm performance analytics
Yield, cost and productivity trends.
Live
Available in the app today. You can use this feature as soon as your farm is set up.
The problem
Plenty of data, very few answers
- Reports are built by hand in spreadsheets.
- Advice is generic and ignores your own records.
- Charts don't say how much you can trust them.
How farm performance analytics helps
Yield, cost and productivity trends.
It is part of Analytics & Intelligence, so what you record here is already linked to the rest of the farm — no second spreadsheet, no re-typing.
Key capabilities
What farm performance analytics works with
Your farm's own records
Weather and season context
Answers that show where the facts came from
How it works
In four steps.
- 1Records build up from daily work.
- 2Dashboards compare fields, seasons and enterprises.
- 3Ask the AI advisor about your farm.
- 4Check the sources shown under each answer.
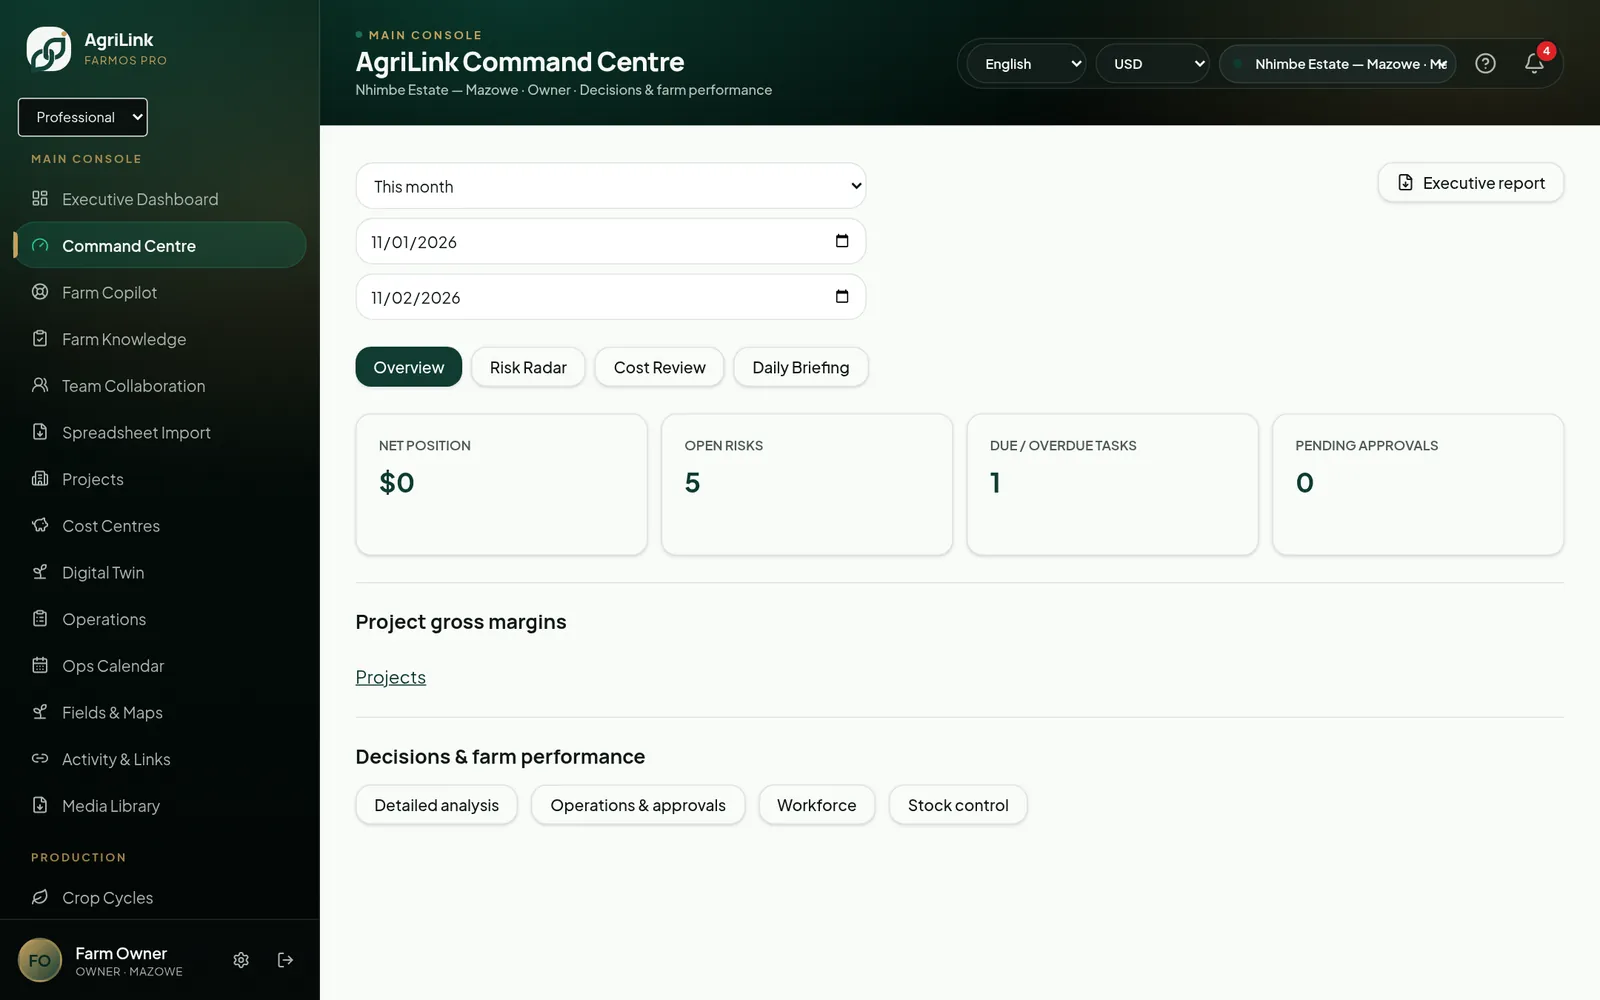
Real AgriLink screen · sample farm data
Connected features
More in Analytics & AI
- Executive dashboardsOwner and manager overviews.Live
- Customisable dashboardsChoose and arrange widgets.Planned
- Interactive KPI cardsHover previews of underlying records.Live
- KPI drilldownsFrom a number to its records.Live
- Comparative analyticsFields, seasons and enterprises compared.Live · limited
- AI Farm AssistantAdvisors that read your farm records.Live
fact-checked
AI answers against your records
drill-down
from any number to its records
en/sn/nd
advice languages
Start using farm performance analytics this week.
You can use this feature as soon as your farm is set up.